When the Dashboard Becomes the Business
A dashboard can be accurate, useful and trusted — and still provide an inadequate view of the business for the decision being made.
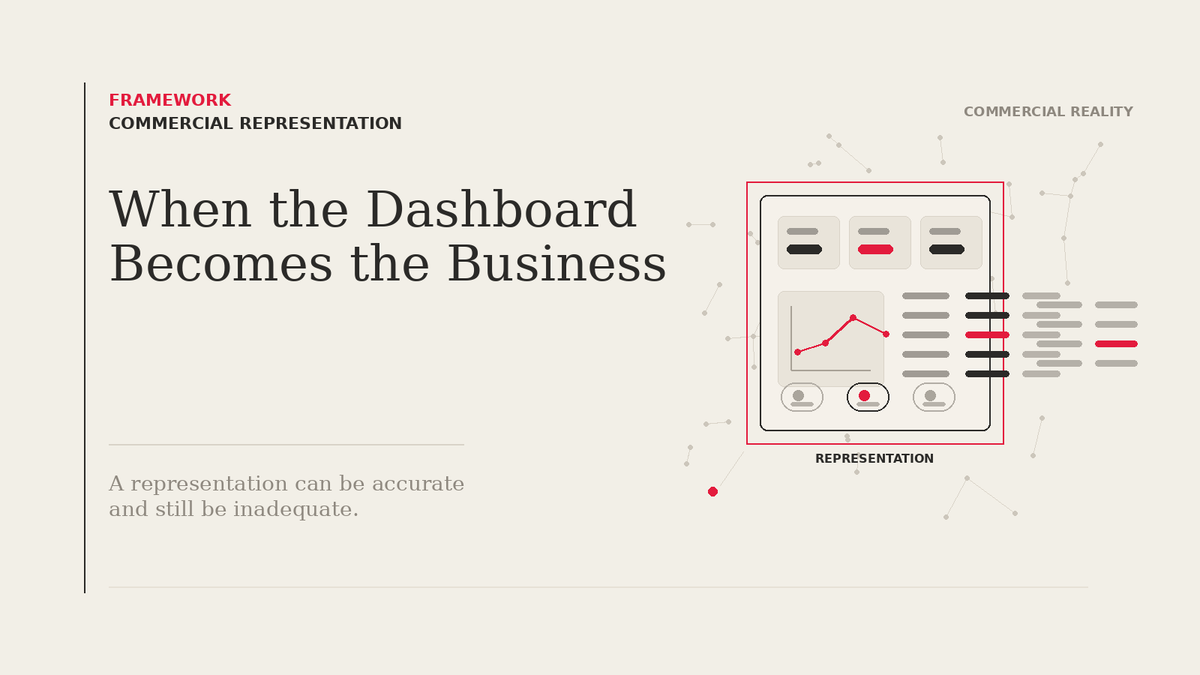
A representation can be accurate and still be inadequate.
Principle
Organizations act on representations of Commercial Reality, not Commercial Reality itself.
The quality of a representation depends not only on whether its numbers are correct, but on whether it preserves enough of the relevant reality for the decision being made.
I have been in many meetings where, after a few minutes looking at a dashboard, everyone starts talking as if the dashboard and the business were the same thing.
“Sales are up.”
“Traffic is flat.”
“Conversion improved.”
Nobody is doing anything wrong.
We need those numbers to have the conversation in the first place.
Commercial Reality is too complex to manage directly. Too many transactions, shoppers, stores, products, promotions, behaviors and competitive effects are happening at the same time.
So we reduce it.
We build dashboards.
We create KPIs.
We use forecasts, attribution models, reports and scorecards.
The alternative is not some perfect, unfiltered view of reality. Without those representations, management would probably rely more heavily on anecdote, memory, intuition and internal politics.
Simplification is not the weakness of a representation. It is the reason we build one.
The interesting question is what happens once the simplification becomes so familiar that we stop noticing it.
A representation does more than select
It is easy to think that a dashboard simply decides which information deserves to appear.
But it does something else as well.
It gives that information a structure.
The same commercial activity can be represented by store.
By category.
By customer.
By campaign.
By geography.
By margin.
By incrementality.
The underlying transactions may be exactly the same.
But the picture is not.
A dashboard organized around stores invites us to look for differences between stores.
A campaign view makes campaign performance the natural unit of discussion.
A category view makes category dynamics easier to see.
None of those views is necessarily better.
But none of them is neutral either.
A representation does not only shape what we see.
It also shapes the form in which we see it.
And that can influence the questions that feel natural to ask.
Two teams can work from the same underlying data and still leave with very different understandings of what is happening.
Not because one of them has the wrong data.
Because they are looking at the business through different structures.
Accurate does not mean adequate
Imagine a dashboard showing sales growth of 7%.
The number may be completely correct.
The transactions are real.
The period is right.
The calculation is accurate.
But the number does not necessarily tell us why sales increased.
Maybe existing shoppers bought more.
Maybe one brand gained because another lost distribution.
Maybe a promotion brought purchases forward from the following week.
Maybe the growth was concentrated in stores that were already performing well.
Maybe shoppers exposed to a campaign behaved no differently from those who were not.
None of that makes the 7% wrong.
It simply tells us where the representation ends.
That leads to a distinction I think matters.
Accuracy asks whether the representation is correct.
Adequacy asks whether it is sufficient for the decision.
A representation can be very good at the first and still fail the second.
I think of this as representational adequacy: whether a representation preserves enough of the relevant Commercial Reality for the decision in front of us.
Something will always be missing.
That is unavoidable.
The question is not whether the dashboard contains everything.
It is:
What is missing that could change the decision?
Some representations become more authoritative than others
Not every dashboard has the same weight inside an organization.
Some become part of the operating rhythm of the business.
They appear in recurring meetings.
They accumulate history.
Targets are built around them.
Teams become accountable for them.
Budgets may depend on them.
Eventually, a representation can acquire something beyond analytical usefulness.
It can acquire organizational authority.
What appears in it becomes easier to discuss.
Easier to compare.
Easier to assign ownership to.
Easier to act on.
What is represented does not become reality.
But it can become the part of reality the organization is most prepared to act on.
That is a subtle difference, but an important one.
Something outside the accepted view may still matter commercially. It is simply harder to introduce into the conversation because it does not yet have the same language, history or legitimacy.
The right representation depends on the decision
This becomes very visible in Retail Media.
Imagine a dashboard reporting impressions, reach, frequency, playouts and Share of Voice.
Everything may be measured correctly.
And if the question is:
Did the campaign deliver the media that was purchased?
that representation may be exactly what we need.
Now change the question:
Should we increase investment because this activity created incremental commercial value?
Nothing in the dashboard has suddenly become false.
The decision changed.
And with it, the information we need to represent the problem.
Now exposure may need to be connected with transactions, shopper behavior, category effects, comparison groups or incrementality.
The first dashboard was not poor.
It was built to answer a different question.
That is why I increasingly think representation quality is decision-dependent.
A view that is excellent for one decision can be inadequate for another.
Correct representations can be the hardest to question
Bad data is easy to distrust.
Numbers do not reconcile.
Filters are wrong.
Transactions are missing.
Someone notices.
The harder case is when everything works.
The dashboard has been used for years.
The definitions are stable.
The historical comparisons make sense.
Everyone trusts it.
That is precisely when it can become difficult to ask whether the view itself is still sufficient.
A media delivery dashboard can measure delivery with great precision and still tell us very little about incrementality.
A sales dashboard can represent transactions accurately while making substitution between categories almost invisible.
A customer dashboard can show average behavior while hiding differences that matter between groups.
Nothing has to be false for the picture to be incomplete.
We can describe one layer of Commercial Reality extremely well and still have the wrong view for the decision we are trying to make.
The representation should remain open to challenge
I do not think the answer is more dashboards.
Or more KPIs.
And I do not think organizations should treat every number as suspect.
Representations need trust. Otherwise they are not useful.
But trust should not make them untouchable.
Sometimes the most useful question in a meeting is not:
Is this number correct?
It is:
Is this the right view of the problem?
What is this representation making easy to see?
What is it making difficult to see?
Would another way of organizing the same evidence lead us somewhere different?
Is something absent that could materially change the decision?
Those questions are not an argument against simplification.
They are a reminder that simplification took place.
The dashboard is not the business
Go back to the meeting.
Sales are still up.
Traffic is still flat.
Conversion still improved.
The dashboard remains useful.
Nobody needs to turn it off.
But there is a difference between saying:
This is what the business is doing.
and:
This is one useful way of seeing what the business is doing.
The difference sounds small.
In practice, it can matter a great deal.
A representation can be accurate.
It can be useful.
It can be trusted.
It can even be the best representation available.
And still not be enough for the decision in front of us.
The dashboard is not the business.
It is a way of seeing the business.
And sometimes a better decision begins with remembering that another way of seeing it may reveal something this one cannot.
This essay is part of the In-Store Retail Media Framework under Commercial Representation. New readers can begin with Start Here or explore the Principles that guide the Journal.